President Trump is a complete surprise to everybody because he is fundamentally unelectable.   A vast majority of Americans dislike him.  His favorability ratings never got above -9 in the past year while Clinton’s occasionally drifted into positive territory.

Hillary Clinton’s staff  is claiming that the actions of FBI director Comey were the cause  of Trump’s victory.

This is kinda sorta true.

It fails to recognize that Clinton’s defeat was the direct result of Trump’s abilities as one of the best brand managers in the country.

Doubt the description of Trump as a brand manager?  He got educated at Wharton, the #2 marketing school in the country according to U.S. News & World Report reports! Through his own individual efforts he’s built one of the great brands in America: Trump.

Trump:  The Cause

The only way to make Trump electable was by making his opponent, Hillary Clinton, seem like a worse choice.   Trump used his ability and skills as a brand manager to identify susceptible segments of the population and crafted his message to appeal to them.

Specific inactions of Clinton made Trump’s program effective.  On September 9, Clinton correctly identified  Trump’s strategy when she segmented Trump supporters into two camps: Deplorables and Left-behinds.  Instead of making a direct appeal to Left-behinds  she then told her supporters that “Those are people we have to understand and empathize with”.

I had thought her segmentation was brilliant but then was puzzled why she did not scoop the Left-behinds up with a targeted uplift campaign.

Left-behinds are a natural consequence of globalization where factories move from country to country chasing lower costs and new demand.   While workers lost their livelihood, the benefits accrue to the wealthy.  The only way to counter this is by taxing the wealthy beneficiaries to provide the Left-behinds with retraining and other support (childcare, for example) so they can grab a piece of the new economic order.

As Republicans are focused on cutting taxes, this is a program that Democrats should be able to prove is not coming from Republicans and was part of Clinton’s agenda.

Her absolute lack of any emphasis on how her programs would improve the economic welfare of  Left-behind voters created a vacuum that Trump filled.

Hillary Clinton’s advisors ignored Bill Clinton’s pleas and failed to realize that Trump was appealing to the same, non-bigoted blue-collar voters who had elected Obama (who is a black man) in 2008 and 2012 and Bill Clinton before him.

Trump started by promising all sorts of  improbable growth and change that he claimed would benefit the Left-behinds.  Next, he charged her with being a criminal, supported by fact based but negative independent media on her email server and leaked emails.  The void was further filled by appealing-to-the-target but obviously false stories of impending arrests and other investigations.

While Trump was portrayed as promising too much and loose with the facts, a minor sin; Clinton was portrayed as a crook.

Exit polls confirm that this is the reason why he won.  As shown in the chart below, people who strongly favored one candidate over the other picked Clinton, 53% to 42%.     Voters who disliked the opponent picked Trump, 51% to 39%.

exit-pole-dislike-of-other

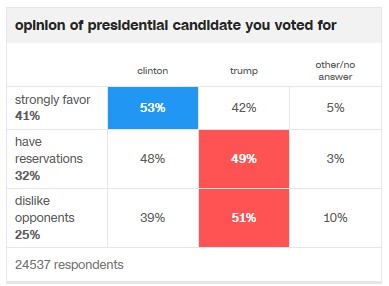
Even so, Trump’s personal nastiness compared to Clinton’s positive personal image (after all, she’s a Sunday school teaching grandmother) means that dislike of her claimed dishonesty would not normally motivate people to get out the vote.

Getting out the dislike-Clinton vote required something else:   Fresh proof of her dishonesty right before the election.

The FBI provided this.   FBI director Comey’s October announcement of potentially more damaging Clinton emails triggered a surge in the anti-Clinton vote.

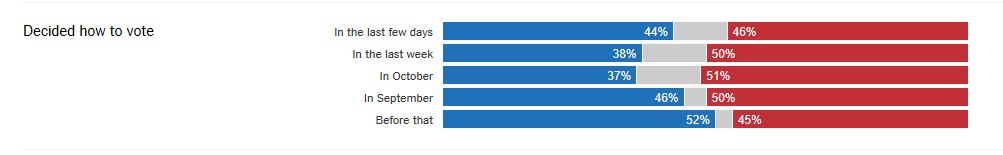
Again, exit polls confirm that Comey’s  actions were critical  in swaying the vote.     The chart below of when actual voters “decided how to vote” shows the breakpoints as Trump’s  strategy gained traction.   First, there was a dramatic  drop in support for Clinton from those who decided before the Deplorables speech  (52% for Clinton) to September (46% Clinton).   Comey’s October announcement was the death stroke: Clinton support dropped to 37% of deciders.   Only in the last few days after Comey declared  the investigation had found nothing new did Hillary’s numbers recover to 44%.  Note that this increase in the last few days refutes Democratic statements that the 2nd announcement was worse than the original.

exit-pole-when-decided-nyt

The major affect of Comey’s announcement was an increase in turnout of Trump voters that was totally unprecedented and a decrease in Clinton voters that broke all the models.

None of the pollsters correctly read what was happening and none of the pundits who claimed to have seen this increased turnout before the announcement were correct:   It only happened because of unpredictable actions by the FBI so they couldn’t have forecast it.

However,  there is no excuse for researchers  and Clinton strategists to have missed this shift as it occurred.   The September shift would have been obvious in every unadjusted poll as it happened.   Any decent brand manager would’ve noted and reacted to this trend.   Apparently, Clinton had too many researchers and political strategists and not enough marketers who have worked in the real world.

Note:    The exit poll above is a shared poll of 24,537  voters sponsored the National Election Pool, a consortium of ABC News, The Associated Press, CBSNews, CNN, Fox News and NBC News.

Trump:  The Effect:

Predicting what’s gonna happen under Trump is difficult because some of the things he’s claimed he’s going to do are unlikely to pass his own Republican-controlled Congress.   Some things are certain to occur: tax cuts,  changes to health care, and  certain types of  deregulation.   Some things are possible but face budget barriers with infrastructure spending being the most likely to be reduced or eliminated.

Before you say I left it out:   All that social stuff on the Supreme Court, gay-rights, and abortion:  Very unlikely to have an economic effect though they will be a catalyst for the 2018 elections.

My question is will the certainties be economic positives or negatives?   Here’s my researched based guesses:

Tax cuts:

  • These have the highest likelihood to occur but will have minimal benefit on economic growth due to concentration at the high-end in both Trump’s and Ryan’s plans. (Ryan’s plan is probably going to be enacted as the House decides what tax bills to forward to the Senate.)
  • Research shows that tax cuts to the wealthy have very little effect on spending. Only the part of Trump tax cuts that benefit the lower 90% of income groups will have any immediate effect on aggregate economic activity.
  • 62% of the Trump tax plan will go to the top 10% of income.  The Ryan plan is slightly different but still very concentrated to the rich.

Deficit:

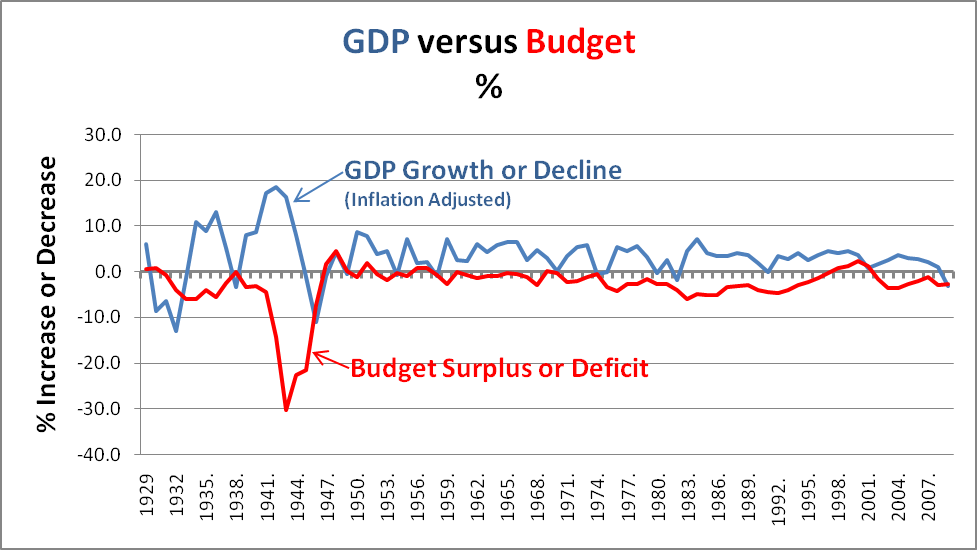
  • Tax cuts will increase the deficit which, à la Minsky, increases corporate profits which may have a benefit on the stock market.
  • The deficit will not cause any economic stress even if it explodes  government debt to well over 100% of GDP.   Historically, government debt has gone as high as 240% (Great Britain and Japan) with minimal effect on growth.   Remember:   All that research on a catastrophic deficit cliff has been debunked due to arithmetic errors.

Inflation fears and growth

  • Deficits per se do not increase growth or inflation when at the zero lower bound (ZLB) of interest rates.
  • The tiny so far increases in interest rates to approximately what they were last year is not indicative of a move off the ZLB.
  • Irrational exuberance may temporarily push interest rates higher but that will probably put them ahead of the inflation curve.  This will be a drag on growth
  • The Federal Reserve’s almost certain interest rate increase in December 2016 will greatly decrease the likelihood of increased inflation, exactly as it is intended.
  • Faster growth will lead to faster increases by the Fed as they try to normalize short term rates, another drag on growth.
  • Overall, anticipation of inflation will probably push rates higher than economic activity merits, slowing growth.

Spending/fiscal stimulus:

  • While deficits may not cause economic growth, government spending paid for by increased deficits can increase economic activity as Trump is well aware.
  • All of the central bank monetary stimulus has primed the pump for fiscal stimulus which the Republican Congress was unwilling to do under a Democratic President – things have changed.
  • Unfortunately, increasing deficits from tax cuts will reduce the willingness of House Republicans to increase infrastructure spending.
  • Direct infrastructure spending is much more effective than tax cuts at generating growth.  It’s in the arithmetic: Tax payers save part of a cut while the government would spend all of it.
  • Military spending will also generate growth but less than infrastructure spending – it does not add to the economic base.
  • Expect strong growth if a large infrastructure program is passed in Trump’s first 100 days.

Financial deregulation:

  • Replacing Dodd-Frank with Glass-Steagall  is effectively a deregulation as Glass-Steagall is no longer  sufficient to regulate today’s  lending markets.
  • Eliminating part of  Dodd-Frank is probably not going to cause any immediate problems as long as capital requirements remain in place.
  • If capital requirements are eliminated, there is a high likelihood of a Minsky moment type crisis as occurred in 2008.
  • Because the  financial markets are  significantly more leverage than they were in 2008, this crisis could occur quicker than most will anticipate – possibly within 2 years.

Environmental deregulation:

  • Even if Trump reduces many  environmental regulation there is unlikely to be much change due to local activism.   The business benefit will be highly specific rather than benefiting broad groups.
  •  Coal is unlikely to come back because it’s being killed by low natural gas prices which are likely to continue for the next 30 years due to environmentally friendlier fracking.
  •  Changes in automobile efficiency goals will have minimum effect on industry profitability.   It makes life a little easier but they would’ve been able to handle the original goals.
  •  Small business may benefit as they may be able to compete in areas that had previously been ruled out due to environmental regulations crafted by large players that only they could afford to meet.

Healthcare changes:

  • Insurance companies are fighting the elimination of Obamacare because they’re afraid of the  combination of  being forced to  insure people with pre-existing conditions combined with  no  universal mandate forcing people to buy insurance.
  • Essentially, this would put every insurance company out of business  as no one would buy insurance until they got sick. People would leave employer plans in droves if there was a viable individual insurance market option.
  • House Republicans will be the  deciders on what happens to healthcare  and they are likely to be much more aggressive than insurance companies would like.
  • The current House plan prevents insurance from being refused due to preexisting conditions and does not require universal insurance but has a “penalty” for late enrolment outside of the original signup period.
  • It’s difficult to tell but there appear to be 3 possible outcomes from the plan:  1. Greatly increased federal costs or 2. Collapse of the individual market back to pre-Obamacare insured levels or 3. Both.   For these reasons, the actual plan will be significantly different than proposed
  • Employer plans will still provide the majority of insurance as the individual insurance market will almost certainly collapse if insuring pre-existing conditions is maintained without a universal mandate.
  • Overall, foreseeable healthcare changes are negative for hospitals, medical services, and insurance companies (unless, of course, option 1 occurs:  greatly increased federal cost.)
  • Pharmaceuticals may benefit if attention is taken off of efforts to lower drug prices.

Consumer spending:

  • There is a slight possibility that consumer confidence will be negatively impacted by the election of Trump.   A recession could occur if the anti-Trump crowd panics and starts increasing savings rates.
  • The next few months of consumer confidence and holiday sales data will indicate what’s occurring in this area.  Currently this data is positive.
  •  Investors should follow the monthly Conference Board Consumer Confidence Index and the weekly Bloomberg Consumer Comfort Index for early indications of changes in consumer spending.

International Trade:

  • While almost all of Trump’s stated trade policies would have negative effects, it is unlikely that anything truly harmful will be enacted.  It’s difficult to change existing treaties quickly.
  • The Trans-Pacific Partnership has very marginal, if any, benefits which are offset by possible negatives so it is no loss.
  • The Paris Agreement climate change treaty does not go into effect until 2020.

Who will benefit:

  • The anticipated tax cuts will benefit the wealthy and will increase concentration of wealth.
  • Job growth should increase at least in the short term, potentially increasing wages for the middle class and working poor.
  • It is unlikely that Trump will be able to increase the minimum wage as promised but this will benefit the lower income groups if passed.
  • Unless Trump develops new programs for rural areas, economic forces will concentrate benefits in the anti-Trump urban areas.

Summary:

  • Overall, Trump’s election should result in at least a short-term boost in economic activity, provided he passes expected tax cuts and spending measures in his first 100 days.
  • Negatively affected will be insurance  and healthcare companies due to changes in healthcare.
  • If there is no decrease in consumer confidence (or hopefully an increase)  consumer spending should continue to buoy the economy.
  • Interest rate increases may choke off the economic expansion if they occur rapidly.
  • If financial deregulation of capital requirements is done there will almost certainly be another fiscal crisis, possibly quickly.
  • It appears that the Left-behind will continue to be left behind.

The impressive report, Public vs. Private Sector Compensation in Ohio: Public workers make 43 percent more in total compensation than their private sector colleagues (the Report), by 2 highly qualified PhD economists comes to an amazing conclusion. How did this big of a disparity come to exist?

Reading the 1st conclusion in the executive summary raises a red flag:

  • actual take-home pay for public employees is 2.5% less than for comparable private workers

Deeper in the Report, actual out of pockets costs for public and private benefits are listed (but not summarized) which are similar to those in a recent study that ranked Ohio Public Employee Retirement System (OPERS) benefits in the middle of the pack of the 15 largest Ohio private employers. Here’s how the out of pocket from each lines up:

Out of Pocket Costs – Public Versus Private Retirement % of Salary


The Report Average of all Corporations

Ohio 15 Largest Private Employers

OPERS Taxpayer Contribution

Social Security

6.2%

6.2%

0

Retirement Plans

6.0%

7.6%

14%

Total

12.2%

13.8%

14%

All of the difference in compensation is due to valuations of benefits compared to private employers, not actual out of pocket costs. The Report’s conclusion is not that the costs of Public Employees’ Benefits are that much different than Private Employees but that Public plans deliver much more value for the buck than Private plans.  

This Report breaks new ground in trying to calculate the value of public sector retirement benefits compared to private sector benefits.  The 43% higher compensation in the title is from two separate calculations: 11.8% for the value of Public employees’ job stability and 31.2% for “fringe benefits”.  

Valuing job stability is difficult as there is no actual out-of-pocket cost to tax payers or performance penalty to act as a baseline plus there are serious issues and outdated assumptions in the Report calculations.   First, 10 of the 11.8 percentage points are from an assumption that public employees would have to take a job with lower total compensation (wages and benefits) if they went in the private sector even though public employees make less take home pay and the higher benefits are being counted in the 31.2%.

Hmm? Isn’t this an unrealistic “Scrooge” pay plan that counts an imaginary 10% cut as part of your compensation?  Never mind, let’s just agree to throw this 10% out as double counting.

Public employees’ greater job security was valued at 1.8% of compensation based on unemployment differentials that the report did not adjust for the “switching” from public to private employment.  In any case, there is no premium from public job security today:  Government is predicted to continue cutting jobs while the private sector is growing. In October 2011, government shed 24,000 jobs while private employers added 104,000 according to the Bureau of Labor Statistics

The Report concludes “when pay and benefits are taken into consideration public workers receive 31.2 percent more in total compensation than private sector counterparts%.”  There are 2 areas that need to be investigated to figure out if the report is right:

  • What is a “private-sector counterpart” and is this comparison correct?
    • The report compares public employees to the average for full time employees at medium to large private employers.  This appears reasonable.
    • The comparison calculates the difference in ““pension compensation” which represents the present value of future employer funded pension benefits accrued in a given year of employment.”  The calculations in large part depend on the fact that public employees have defined benefit programs while most private employees have defined contribution programs.
    • This difference between defined-benefit programs at private and public employers has mostly arisen since 1980 so this comparison shows how much compensation private employees have lost since 1980 – if the calculations are correct.   The Employee Benefit Research Institute (EBRI) has compiled historical retirement plan data, though the early years are slightly different for public and private data. Plan coverage for full time employees at medium to large private employers has declined from 91% in 1985 to 66% in 2010 while public employee retirement plan coverage declined from 98% in 1987 to 94% in 2010.   Defined benefit plan coverage for private employers had declined from 84% in 1980 to 30% in 2010 while Public employee coverage by defined benefit plans has only declined from 93% in 1987 to 87% in 2010.  This data is summarized in the table below.
Plan Type

1980

1985

1987

2010

Private Public Private Public Private Public Private Public
All retirement

N/A

N/A

91

N/A

N/A

98

66

94

Defined benefit

84

N/A

80

N/A

N/A

93

30

87

Defined contribution

N/A

N/A

41

N/A

N/A

9

54

19

Source:  EBRI compilation of the US Department of Labor, Bureau of Labor Statistics data

  • Is the calculation that public employee benefits are 31.2% greater value than private benefits correct?  If not, what is the true difference?
    • The 31.2% is based on using an “ivory tower” riskless rate of return rather than actual, “real world” investment returns to calculate the value of Social Security benefits and future liability for Public retirement plans. The note below goes over the paradox that “risk free” securities are not free of investment risk.  As benefits are paid in the real world, real world rates of return are appropriate.
    • Social Security benefits and returns are mandated by Congress rather than based on investment returns so there is validity to the fact that Public retirement plans investment returns are better than Social Security.  The Report calculated this to be an effective 4.2% reduction in private employee compensation based on the riskless rate of return.   The actual difference is greater as Public retirement benefits result from actual rates of investment return. There was a major adjustment down in SS benefits in 1982 (rather than an adjustment upward in returns) to match income and liability so most of this difference is the result of a reduction in benefits to private employees.  
    • The remaining 27% difference is not valid because it is based adjusting Public plan benefits to reflect an “ivory tower” riskless rate of return rather than a real world actual rate of return on investments.  As benefits are paid in the real world and there is no evidence that Public retirement plans to use an incorrect rate of return, there is no basis for increasing public compensation to cover retirement plan shortfalls.

In summary, it appears that the Report reveals that Private employees are similar in total out of pocket benefit costs to Public employees but the value of benefits received is greater for Public employees. The majority of this difference is due to the congressionally mandated lower return on Social Security contributions.

An unanswered question is whether the major shift of private employers from defined benefit to defined contribution retirement programs has resulted in additional reductions in private versus public employee benefits.

* Note on the Report’s calculation of retirement benefit costs. 

The question here is whether the “risk free” rate or the rate of anticipated return, as is currently done, should be used as a discount rate for public defined benefit plans.

The comparison is made to private plans which use the more conservative corporate bond rate rather than the estimated return on investment.  The reason the rate is specified for corporations is so they cannot manipulate the rate to increase their profits by lowering their required contribution. Public entities don’t have this “profit” motive that is proven to lead to so much abuse.  There is no proof that there is a widespread problem with public pension plans using improper rates of return while there are many examples of improperly funded private plans. 

The statement in the report that “For these purposes, however, all that matters is that the accounting be made consistent between different pension types” is totally incorrect as the dangers of abuse to each plan are significantly different.  Accounting standards are designed to eliminate potential misstatements and abuse. Financial analysis is needed to establish whether there is adequate funding and accounting standards’ requirement of eliminating abuse can and do conflict with getting the best possible financial statements.

Using the “risk-free” rate cannot give a clear picture of the financial status of a retirement plan. First, you need to understand that the “risk-free” rate is not actually free from risk.  “Risk-free” securities are free from default risk.  Default risk is the risk that the company or country will not be able to pay when the security comes due.  Because the U.S. Government prints dollars, the possibility that it will default on its bonds is zero so they are “risk-free”. (Even Congress cannot default on these debts as the 14th amendment states “The validity of the public debt of the United States, authorized by law, including debts incurred for payment of pensions and bounties for services in suppressing insurrection or rebellion, shall not be questioned.”)

But default risk is very small for any investment grade security – that is why they are “investment” grade. The real risk for any bond is interest rate risk. Even government bonds have interest rate risk; in fact, interest rates changes often make government bonds prices more volatile than the stock market.  The chart below shows the “risk-free” rate on the 10 year Treasury bond from 1960 to the present. As you can see rates have varied from over 15% down to the current rates of below 3%, a 5 fold range.  

The wide, year to year swings in interest rates has resulted in significant problems with private plan funding which are being partially addressed in proposed international accounting rules.   The rate of anticipated return does not have the skew caused by wildly varying interest rates and is preferred on a financial basis when the entities involved are trustworthy. History has shown that governments are much more trustworthy than corporations in financial reporting and accounting standards reflect this.  New proposed Government Accounting Standards Board (GASB) rules have affirmed this is appropriate for existing public defined benefit plan assets with discussions purely focused on how to report funding shortfalls.   

Finally, there’s no proof that Ohio pension plans are significantly underfunded on a long-term basis as alleged in the Report.  The cited Congressional Budget Office report, “The Underfunding of State and Local Pension Plans” (May 2011), looked at the funding gap that occurred in 2008 and 2009 during the depths of the recent recession when asset prices were depressed. Since that time there has been a recovery in asset prices that has closed most if not all of the gap.


Using patient education to manage expectations may be the only way to address some HCAHPS survey issues because of factors that are built into the questionnaire.  The design process for the HCAHPS survey resulted in some questions that are difficult to completely address with operational improvements.

The survey problems are unavoidable because each hospital must use the standard survey, without any ability to adjust questions to match situations that are unique to them or correct test biases that are negative to them or clarify question intent.  The only tool they have in these cases is management of expectations which can best be done under a consistent and uniform patient education program.

Patient education has been proven to be effective at improving outcomes but an internet search shows that most HCAHPS improvement programs focus on staff and operational issues, with minimal, if any, changes in standard patient education programs.   Efforts to establish realistic patient expectations through a uniform, planned patient education program seem to be lacking and there are no publications that combine “patient education” and HCAHPS in the MEDLINE/PUBMED medical publication search engine. 

Understand HCAHPS Flaws

Understanding the flaws in the HCAHPS survey requires knowledge of both the national scores and the correlation of ratings and recommendations with the individual questions. A study[1] in the New England Journal of Medicine looked at these correlations and this data is given below along with the average national hospital scores for what is called top box scores (definitely, always or 9-10 ratings).

The scores are highly correlated yet the correlation is lower for recommendations than for ratings.  This must be because the HCAHPS survey does not completely cover the reasons people make recommendations.


In addition, the correlation varies significantly between questions, with “Nurses communicated well” which had relatively high performance of 74% “always” and a correlation of .70 with recommendations compared to another important operational question “Patients received help as soon as they wanted” which had had the lowest “always” at 62% and lowest correlation, .46.

Ratings and Recommendations Correlations to Individual Questions
 Compared to National HCAHPS Scores


Correlation With

Average For All Reporting Hospitals


Patients who gave  hospital overall rating of “9” or “10” (high)

YES, patients would definitely recommend the hospital

YES, patients would definitely recommend the hospital

0.91

1

68%

Patients who gave  hospital overall rating of “9” or “10” (high)

1

0.91

64%

Nurses “always” communicated well

0.77

0.70

74%

Pain was “always” well controlled

0.75

0.69

68%

Staff “always” explained about medicines

0.69

0.63

59%

Yes, staff did give patients  information about recovery at home

0.61

0.60

80%

Doctors “always” communicated well

0.62

0.55

80%

Room was “always” clean

0.62

0.52

69%

Area “always” quiet at night

0.56

0.48

56%

Patients “always” received help as soon as they wanted

0.56

0.46

62%


Manage Specific Issues

There are at least three specific issues that cause these variations, affecting half of the HCAHPS survey (9 of 18 evaluation questions.)   Active management of patient expectations is an important way to correct these issues as detailed below:

1.       Realistic Patient Expectations of Service.  It is almost impossible to get improvement in some areas without realistic patient expectations as to what good performance is.  There are three service questions in the HCAHPS survey that require establishing what patients can expect.

First and most important is call button response, reported on Hospital Compare as “Patients received help as soon as they wanted.”   This question has one of the lowest national 9/10 top box scores (62%) and also has the lowest correlation with patient ratings and recommendations. 

This is an issue of “wants” (what you would like) versus “needs” (what you must have.)   Patients may think that call button response does not meet their “wants” but realize that their desires for rapid service are not very important compared to the “needs” of themselves and others that keep nurses from responding immediately.   Any hospital that tries to delivery cost effective care has to focus on meeting “needs” rather than the 5 star hotel “wants” service that this question asks about.

Simply shortening call button response time may not improve scores significantly because the “wanted” time could be zero or close to it.  Getting a meaningful improvement in this score requires explaining to the patient what reasonable call button response is so that they form a realistic expectation where their “wanted” response time is close to the “needed” response time that nurses are trying to meet.  This will increase patient satisfaction while making the scoring more likely to reflect this expectation and increase its usefulness to both patients and hospitals.  Note that there is a balancing act in explaining why the response time is not immediate as one that is too long will likely lower both this score and recommendations. 

The two other service questions that need expectations established are the two identical questions for Nurses and Doctors on treating patients with “courtesy and respect.”  While most people are experienced in evaluating whether a waiter is treating them with “courtesy and respect”, they are probably not used to evaluating this during the rushed activities of a hospital, particularly when treatment is underway or patients are confused from medication or illness.  The problem is that testing the concepts of courtesy and respect is done with a multipoint questionnaire so a single question is inadequate to identify issues.

This actually affects 6 total questions as “courtesy and respect” scores are blended together to with questions on whether Doctors and Nurses “listen carefully” and ”explain things” to make a composite “communicate well” score that is available to patients.   Nurses’ “communicate well” had the highest correlation with hospital ratings and recommendations of any question, showing the importance of the nurse’s role to patients.

The opportunity for improvement in care delivery is to clarify to both patients and staff how “courtesy and respect” is done at the hospital.  For example, educating and reassuring the patient and family on respect concepts such as “treatment with dignity” will add to their comfort with treatment and increase satisfaction[2].   Finally, linking the concept of courtesy and respect to the concrete actions in the later two questions of “listen carefully” and “explain things” allows patients to evaluate a performance that can be divorced from the busy activities of a major hospital delivering cutting edge, efficient care.

2.       Realistic Patient Expectations of the Hospital Environment.  Modern hospital care ideation in America is usually done on the basis of “absolute best care possible” without much consideration of efficiency.  The questions in the HCAPHS survey reflect this bias.  Except for pain management, questions are worded as absolutes that minimize the likelihood that patients will use their perspective (contrary to the stated intent of the survey.)  

The “quiet” question in the HCAHPS survey is the most affected by this lack of value orientation.  Hospitals are busy, relatively noisy places. The World Health Organization guideline value for background noise in hospital patient rooms is 35 dB, with average noise levels (LAmax) not to exceed 40 dB, about the noise level of rainfall.  The question in the survey is phrased as “how often was the area around your room quiet at night?”  A factual answer to this question might be “Never” even though the patient slept well.  This might be the reason this question has the second lowest correlation to ratings (.56) and recommendations (.48).

If asked on a perceptual basis, such as “How often was the area around your room quiet enough for you to rest well at night” the answer would be more meaningful as there is research that shows better patient outcomes when noise is reduced to a level that does not disturb patient rest.  The opportunity is for hospitals to define “quiet” in the hospital setting so that patients relate it to their rest and well-being, not extraneous noise levels.

This is particularly important to existing hospitals that try to deliver cost effective care.   Studies have shown that there are benefits to the lower noise levels of single rooms but others indicate that there may be offsetting benefits[3] from the socialization in semi-private rooms.  Consequently, the incremental cost of private rooms over semi-private is probably not justified by sound reduction alone if there are not other medical reasons for isolation. 

Most important is that addressing this question should result in improved rest in an unfamiliar environment by educating patients that many of the sounds they hear are due to the efficient delivery of care and are normal in a hospital.  The secondary benefit is focusing them on judging the sounds that disturb them and increasing the meaningfulness of the HCAHPS “quiet” score.

3.       Minimizing Survey Order Bias. The HCAPHS survey is a standard questionnaire where questions are asked in a fixed order.  First are scaled questions (Always, Usually, Sometimes, Never, or Yes/No) then patients are asked for a hospital rating (from 1 to 10) and a recommendation (Definitely No, Probably No, Probably Yes, Definitely Yes.)  This generates what researchers call “order bias” where the questions before influence the later answers. 

The NEJOM article cited above has shown these questions to be highly correlated with one another, an indicator of order bias.  Another indicator of order bias is that hospitals that have strong images and reputations seem to get higher recommendations than their rating scores would merit. This might be because the HCAHPS survey does not completely cover the reasons people make recommendations.  Ratings and recommendations are always asked at the end of the survey so hospitals that don’t have strong reputations would tend to have recommendations that are directly related with ratings.

It would be best if questions were asked in a random fashion to minimize order bias and increase the survey accuracy but this is unlikely to happen.  Informing the patient of the hospital efforts and intent in appropriate areas will minimize order bias caused by lack of knowledge/reputation.  An added benefit is that patients will know more about the positive activities of the hospital which will increase the potential for future recommendations outside the HCAHPS survey.

The HCAHPS survey has serious structural issues that need to be addressed through patient education that establishes expectations for the individual care areas.  Traditionally, this is been left to the individual nurse and doctor to communicate but the opportunity is to establish a consistent patient communication/education program.  A consistent program could have measurable goals and outcomes that would be subject to review and improvement.  The bonus is that a successful program would build the hospital’s reputation and lead to increased patient satisfaction.

 *Sidebar:  What can you say to Patients about HCAHPS?

Before we talk about using Patient Education with the Hospital Consumer Assessment of Healthcare Providers and Systems (HCAHPS), we have to address whether it is even allowed under HCAHPS guidelines. After all, using Patient Education to increase survey scores seems like it might be directly contrary to the intent of the survey. The expectation on what the HCAHPS survey is measuring is clear: 

…to the fullest extent possible…patients’ responses are informed only by the care they received during the hospital stay.

                                                                 HCAHPS Bulletin Number 2009-01 Revised

To make sure that hospitals understand what they can do, the Quality Assurance Guidelines include a section on “Communicating with Patients about the HCAHPS Survey” shown in Table 1.

Further clarification was given in HCAHPS Bulletin Number 2009-01 Revised, The Use of HCAHPS in Conjunction with Other Hospital Inpatient Surveys which was quoted in part above.  The comments that guide how patient expectations can be managed are:

“In general, activities and encounters that are intended to provide or assess clinical care or promote patient/family well-being are permissible.

However, activities and encounters that are primarily intended to influence how patients, or which patients, respond to HCAHPS survey items should be avoided.”

A strict interpretation of HCAHPS guidelines would be that patient education (that is, direct patient communication) can be used to improve HCAHPS survey scores as long as they avoid using any of the HCAHPS specific terminology and are intended to primarily improve patient outcomes rather than increase survey response rates or scores.

Table 1

CAHPS® Hospital Survey (HCAHPS)

Quality Assurance Guidelines

Version 4.0 February 2009

Communicating with Patients about the HCAHPS Survey

HCAHPS guidelines allow hospitals/survey vendors to communicate about the HCAHPS survey; for example, hospitals may inform patients that they may receive this survey after discharge. However, certain types of promotional communications (either oral or written or in the HCAHPS survey materials, e.g., cover letters and telephone/IVR scripts) are not permitted, since they may introduce bias in the survey results. Hospitals/Survey vendors or their agents are not allowed to:

·         ask any HCAHPS questions of patients prior to administration of the survey after discharge

·         attempt to influence or encourage patients to answer HCAHPS questions in a particular way

·         imply that the hospital, its personnel or agents will be rewarded or gain benefits for positive feedback from patients by asking patients to choose certain responses, or indicate that the hospital is hoping for a given response, such as a “10,” “Definitely yes,” or an “Always”

·         ask patients to explain why they did not rate a hospital with the most favorable rating possible

·         indicate that the hospital’s goal is for all patients to rate them as a “10,” “Definitely yes,” or an “Always”

·         offer incentives of any kind for participation in the survey


[1] Jha, Ashish K., Orav, E. John, Zheng, Jie, Epstein, Arnold M.
Patients’ Perception of Hospital Care in the United States
N Engl J Med 2008 359: 1921-1931

[2] Beach, Mary Catherine, et al. “Do patients treated with dignity report higher satisfaction, adherence, and receipt of preventive care?.” Annals Of Family Medicine 3.4 (July 2005): 331-338. MEDLINE. EBSCO. [Library name], [City], [State abbreviation]. 23 Sep. 2009 <http://search.ebscohost.com.ezproxy.cpl.org/login.aspx?direct=true&db=cmedm&AN=16046566&site=ehost-live>.

[3] Dolce, J. J., Doleys, D. M., Raczynski, J. M., & Crocker, M. F. (1985). Narcotic utilization for

back pain patients housed in private and semi-private rooms. Addictive Behaviors, 10(1),

91-95.


Self test on whether you think healthcare is a right or a privilege (from an event that actually happened):

Imagine you are at the beach and see a person in obvious physical distress, not drunk, but possibly having some sort of medical event:

  • If you help them (or think someone should help them), you think healthcare is a right.
  • If you pass them by as you say to yourself “they should get help”, you think healthcare is a privilege.

This is a quick guide on who’s likely to win or lose with healthcare reform.  It’s for those too busy to study it or who lack the background in economics, financial markets and business necessary for a broad view of what’s likely to happen.  Particularly, this is for my wife, who is one of the dedicated healthcare workers who has been worried by the claims of disaster but know from real experience that there are opportunities to deliver better care.   

I’ve had the privilege of recently talking to a number of major hospitals’ Chief Nursing Officers (CNO’s) about the proposed healthcare reform and have found that most of them are concerned that reform will make delivering quality care more difficult due to payout reductions.  They admit that they have limited knowledge of what the plan actually entails because their 60 hour (or more) workweeks actually making sure care is delivered properly don’t allow them the time to study it – some number cruncher somewhere else in their organization is looking at it.

The recent endorsement of the house version of the health care reform bill by the American Medical Association let me know that many doctors have already decided that reform will improve things.  While doctors might be motivated by some payment changes promised in the House plan, the American Nurses Association has endorsed it too which makes me think that there is good reason to believe that patient care might actually improve.  

So if nurses are concerned about care and doctors think it might be OK for whatever reason, why do most stories state that health care reform will be a disaster for all except the currently uninsured?   In fact, the worst of the horror stories has the plan bankrupting the country, not covering all the uninsured, destroying insurance companies and small business while reducing the health coverage of the currently insured.  It looks like the groups that will be hurt are putting on a full court press to stop reform and save their bacon. Their complaints plus the whining of the obvious winners about individual provisions is making it difficult for the average person to understand what is happening.

As a business person with turnaround experience, I can see that healthcare cost savings are an opportunity because other developed countries spend no more than 11% of GDP on health care for equal or better outcomes while we spend 16%.  A turnaround manager coming in to a bankrupt company with this sort of health care bill would see this as low hanging fruit that can be quickly harvested (think GM.)    The Congressional Budget Office estimates there will be no savings from reform so I’m going to do what good managers always do when someone who is part of the failing company makes an emphatic statement:  Ignore them and try to find out the truth  (note this link from Paul Krugman on the CBO estimates on Healthcare.)


More importantly, if the low hanging fruit is 5% of GDP, there should be more than a few winners that a smart investor would want to back.  The problem is that we don’t know exactly what healthcare is going to be.  Let’s try to find the winners and losers and look at the opportunities where the only certainty is the requirement to buy insurance and more or less guaranteed affordable coverage (no rejections by insurance companies) which will achieve universal coverage (Congressional Budget Office estimates that plans like this will cover 97% of legal residents).

 Losers:

Insurance Companies:  The big loser in any universal insurance program is current healthcare insurers.  Even without the “public option” where insurance is directly issued by the government, healthcare insurers will see dramatic reductions in profits.  Premiums from insuring “risk” will essentially be removed from Insurance companies and they will make money by being the most efficient processor.  Their ability to make money by dropping people likely to be expensive will be eliminated and rates premiums will be restricted, possibly to as low as 2 times the base rate. 

Selling “gold plated” insurance (with benefits much greater than the required plan) will probably be limited to no more than 40% – 45% of the current market (roughly, based on European programs) and even this will be of limited profitability as the public option is being design to mimic current coverage and appears comprehensive.   Gold Plated plans will have to offer faster access to specialists (if possible) and treatments that are not approved by the base plan which, based on the European and Canadian plan treatment offerings, will be restricted to new, unproven, elective or lower efficacy treatments.  Some people will find this appealing but most people want to stay away from the doctor’s office and avoid questionable treatments.

The overall lower risk of insurance after healthcare reform will severely reduce insurance company margins and should give significant advantages to the largest operators who can generate economies of scale and technology.  The net result should be significant industry consolidation which may be an investment opportunity.  This consolidation may be slowed down by state Insurance Board activities to protect local insurers at the cost of higher in-state insurance rates (the final law may forbid this.)  If either the “public option” or the Health Insurance Exchange exists, state protectionist activities will not work due to the existence of a baseline comparison visible to all insurance purchasers.


Free Riders:  A free rider is a person or company that can afford health insurance but, for whatever reason, decides not to purchase it.   There is not much economic effect from mandated healthcare insurance with this group as they have the resources, just don’t pay their fair share of the cost.

Individuals in this group are lottery players betting they won’t need health care, and, as a group, would be better off financially with healthcare insurance.  The cost for the individuals who actually need health care is either 100% paid out of their assets or becomes charity care when their assets are exhausted.

Free riding companies, usually small businesses, shift the burden of health care insurance to other companies and organizations as most people do have insurance either from spouses or other relationships (VA, etc.)  As their employees are already covered by insurance and it’s no significant burden for these companies to pay for insurance this will be a wash with no significant economic effect on the company or the country’s economy.

Marginal Small Business:  Small business is the heart of the uninsured problem.  According to the Employee Benefit Research Institute, 26 million of the 46 million uninsured are the owners, employees or dependants of Small Business (usually defined by the Small Business Administration as a company with less  than 500 employees; some industries it’s as low as 50.)

Some small businesses that do not offer health benefits and are struggling to meet payrolls and achieve profits may suffer under an enforced insurance plan.   The proposed plan imposes an 8% tax on payrolls of employers who do not offer healthcare. 

Small businesses with less than 10 employees and an average salary of $20,000 or less will only pay 4% tax (the difference is given back as a tax credit.)  This tax will increase from 4% to the full 8% on a proportional basis as employees go from 10 to 15 and average salaries go from $20000 up to $40000. Small businesses with 15 or more employees and/or $40,000 in average salary will pay the full 8%.  An average salary of $40,000 would pay a tax of $3200, while the average cost of insurance for a family is $12,000 or more.  This is a really big savings for low wage firms that currently offer health care insurance.

Census data is not broken out exactly this way and the closest break is firms with 9 or less employees which are 15% of all firms employing 11.1% of the workforce and paying 8.5% of salaries.   About 49% of these currently offer health benefits to their employees according to the Kaiser Family Foundation and would see a significant reduction in their healthcare insurance cost from the current bill. The 51% (about 7% of all firms) that don’t offer healthcare might be negatively affected. 

The net effect is that Small Business is ahead under the plan but it may be the final stroke for struggling companies.

Non-Medicare/Medicaid (Non-MM) Doctors and Hospitals – Some doctors and for-profit hospitals do not currently accept Medicare or Medicaid patients and might see significant decreases in income if patient volume or payout decreases under healthcare reform.  This group would include some for-profit doctor owned hospitals and clinics but not non-profit doctor organizations like the Cleveland Clinic or for-profit doctor owned hospitals with extensive Medicare and Medicaid practices.  Note that Non-MM groups may suffer loses even if healthcare reform results in higher payouts than current Medicare and Medicaid.  Both the nature of their relationship with private insurers and private insurers’ ability to absorb higher rates by expelling sicker patients will change.  Particularly vulnerable will be specialists who generate high incomes by doing large numbers of fee-for-service procedures that are of questionable benefit.  Orthopedic surgeons that do hips would be unaffected but those that do back surgery purely for pain relief will have to modify their practice.

Note on the Wealthy as losers:  The current plan has a direct tax on those making over $350,000 per year to pay for healthcare reform.  While I could put them down as losers under health care, I haven’t because they are almost certain to see tax increases so linking the increases to healthcare is a distortion.  The wealthy seem doomed to tax increases; particularly when you consider that there is no theoretical reason to tax capital gains at a preferential rate compared to other income (when there is a sophisticate capital market, income is income and its origin does not affect the amount of investment.) Lower tax rates for capital gains can actually be shown to distort investment into unproductive programs that would not be undertaken without tax advantages.  

Winners/Whiners:

Healthcare reform is made even more difficult to understand because even the obvious winners whine about the proposed plans. 


For example, since 1986 the National Federation of Independent Business’ (NFIB) members have said that healthcare costs are their No.1 concern yet the NFIB opposes both employer mandates and the public option.  78% of firm with 10 to 24 employees and 90% of firms with 25 to 49 offer health benefits and these firms pay an average of 18% more that large firms so it’s pretty obvious that they will be better off if they can get the same insurance rates as large business and the mandate is a non-issue.   Nevertheless, NFIB is one of the most vocal opponents of the current healthcare reform; possibly due to a scary but flawed study that actual supports some of the benefits of the public option.  (This study is reviewed in the Small Business section below.) 


Here are the winners and their whines:


Currently Insured


The currently insured are the group that appears most confused.  Polls show agreement that healthcare needs reform which is combined with concerns that the insurance they have will be reduced.  The truth is that the insurance they have is steadily decreasing due to cost increases and free markets can’t cure this.


The reason that the currently insured are concerned is that estimates of the proposals don’t assume any significant cost savings.  The Congressional Budget Office (CBO) refuses to include any calculation that healthcare costs will be reduced in their estimates because the exact details of the savings can’t be foretold.  The CBO discusses many proven cost saving measures and then dismisses them from budget calculations.  For example, the budget savings for the reduction of payments for ineffective fee-for-service is calculated only on the dollar reduction without any additional savings from the linked increase in lower cost outcome based treatments that must occur if ineffective treatment is reduced.


Any estimate that included cost savings shows a large benefit for the currently ensured.  If the estimate assumed that we would drive our costs down to those of the next lowest developed nation, the total savings would be approximately 30% with the currently insured benefiting even more. Finally, the currently insured would not have to worry about losing insurance if they actually became ill so there would be a reduction in bankruptcies which could be easily calculated.


American Large Business


All American Large Businesses offer health benefits (99% of firms with 200 or more workers) so anything that will lower costs will benefit them and make them more competitive.  American Manufacturers will be the biggest winners because they have the most competition from countries where healthcare is much less expensive, not offered or covered by lower cost universal programs.  A good example of this benefit is the fact that GM is profitable in Europe where there is universal healthcare.


Costs for companies that currently offer healthcare will decrease slightly once universal healthcare is enacted for a very simple reason: the government will be picking up the cost of the uninsured and paying for it with deficits in the short term and general tax increases in the long term (possibly in the short term, too.)  As companies that offer health insurance usually pay 75% of the total cost, this transference of cost will disproportionately benefit companies that currently offer insurance.  This benefit for companies will occur even without any of the savings that can be expected from a universal health care plan.


Some companies whine about increased cost but it is clear that the universe of American Companies will benefit due to lower costs.  Those companies that will fail due to being forced to pay the cost of insurance are marginal producers that don’t currently carry healthcare insurance.  These represent no more than 1% of firms with 200 or more workers, according to the Kaiser Family Foundation (some of these firms are profitable and currently choose to free ride.)


Wal-Mart supports healthcare reform and lays out why clearly in their letter to President Obama.  Manufacturers like GM and the steel industry would benefit the most which may be why many also support healthcare reform.


Entrepreneurs


Anybody who’s ever lost or change jobs and gotten a COBRA form knows the truly staggering cost of individual health insurance.  If you or anyone in your family actually has a health problem then health insurance will be unaffordable.   A friend of mine who was relatively well-off retired in his 40s because his high stress job was making his diabetes worse.  After discovering that he was uninsurable, he took a much lower stress and pay job at a nonprofit to get insurance.  This story has a happy ending: he loves what he is doing and the nonprofit is ecstatic to have him and continually offers him promotions which he turns down.   My friend was lucky; most people have to stick with the job they have until they are too ill to work to make sure they get health insurance.


 The typical entrepreneur is not a young person but rather an experienced business person who is older and more likely to have health problems. Eliminating the barrier of lack of insurance will allow people who currently have the resources and ideas to start new businesses to open small businesses.    Small businesses are the generators of two thirds of new jobs so removing barriers to their startup will increase economic growth.


Doctors and Hospitals


Doctors and Hospitals have the biggest potential to benefit financially from the switch from fee-for-service to outcome based payouts.  Not performing unnecessary services means more funds are available for payment as rewards for good outcomes.  Accountable Care Organizations, modeled on the Cleveland Clinic and the Mayo Clinic, are included in the current bill in limited form.  A secondary benefit for doctors could be more time to spend with patients. 


Doctors and Hospitals would also benefit from significantly lower paperwork (after insurance company consolidation) and insurance on almost all patients.  Currently a significant portion of doctor’s income is spent on filling out insurance forms and screening patients for ability to pay.   Hospitals have the same issue with paperwork but can’t screen patients so they have to absorb much of the cost of the uninsured.  Finally, the current bill has provisions to increase payments to family practice physicians.


Significant investment opportunities may exist with for-profit hospitals that embrace the Accountable Care Organization model.


Small Business


Very Small Business (up to 15 low wage employees) would have additional cost savings under the proposed plan as there are supplements for low income individuals which would make it easier to attract people even at the minimum wage.  The 4 to 8% of salary that these businesses would be required to pay is far below the actual cost of insurance for a minimum wage individual.


As mentioned above, NFIB, a leading small-business organization, recognizes the need for health care reform but is adamantly opposed to the current plan.  This appears to be due to a study they commissioned that did laboratory testing of small-business behavior under various healthcare models.   This study is flawed in that it did not benchmark the real world as the base case and did not assume any cost savings under any of the universal insurance test cases.  This lack of real world linkage is a typical problem with today’s academic economists and fixing either of these assumptions should show a real benefit for Small Business.   


 The Small Business Majority, another small business organization, commissioned Professor Jonathan Gruber of MIT to model small business performance under three real-world healthcare reform scenarios.  Each of these situations showed small business to be far better off under health care reform.


Summary


The failures to recognize the benefits of health care reform appear to be caused by the refusal to recognize the cost savings from reform for both individual companies and the country as a whole.  Fortunately, the USA is not bankrupt yet but with current health care growing at 8% a year, the country is doomed to shrink economically unless it controls the cost of health care.  Major companies from Wal-Mart down recognize this and have endorsed health care reform. 


Investors should support health care reform as a way to strengthen United States economically while they look for those companies that could benefit.    Specific opportunities will be explored in more detail in future posts.

Dear Mom,
You’ve taught me the value of trusting in others and hoping for the best and I’ve been very successful as a result. Now is the time for me to show you how I’ve learned to apply what you taught me. 
I’ve learned that people who make money with other people’s money won’t necessarily tell you everything you need to know when it is your money. For example, that mutual fund representative who told you that now was a good time to invest in the stock market didn’t tell you that the market hadn’t reached a historical valuation bottom. When he said that it might go lower, he didn’t mention that it had always gone lower from the market levels on Mother’s Day 2009 after a speculative top like in 2000.
I’ve learned that you should listen to people who don’t get paid if you invest. People like Robert Shiller who wrote Irrational Exuberance explaining the market cycles. Professor Shiller keeps the Price Earnings valuation chart from his book updated on the internet for anyone to look at for free at http://www.irrationale… (this uses 10 year average earnings to smooth out variations.) The chart below shows that the S&P 500 stocks have not hit the historical bottoms like they did after the peaks in 1901, 1929 and 1966. On May 5, the S&P 500 was more than twice as high as the historical bottom so you could lose one half your investments if you invest today.
 

I’ve learned that the internet has made it easier to find data you can trust. Standard & Poor’s calculates the S&P 500 stock market index and puts the data and future earnings estimates online at www2.standardandpoors….SP500EPSEST.XLS. Currently, the last 12 months reported earnings have a PE of 119. Standard & Poor’s does not project the PE ratios to improve until after the 3rd quarter 2009.
Finally, I’ve learned that our government officials don’t have the courage to control things that are obviously going wrong. When Alan Greenspan was Chairman of the Federal Reserve he had access to the same charts that you do so he could see that the stock market was at historic highs yet he didn’t even try to talk down the market. Now, we have banks that are not lending because they are broke yet our current Treasury Secretary and Federal Reserve Chairman are not taking the actions needed to quickly fix these problems. Maybe their plan will work eventually but history states it will take years, maybe more years than you have left.  
A retired widow like you should wait until after the market bottoms to risk any money in the market. In fact, the best Mother’s Day Gift I can give you is to convince you to sell all your stocks after the recent rally.
Your Son,
The One Eyed Guide
S&P500 PE History

S&P500 PE History

In sales, there is a technique to make buyers decide to purchase called the “Ben Franklin Close”.  It is a simple two column list with all the reasons to buy on one side and all the reasons not to on the other.  The side with the greatest number of reasons shows which decision to make. 

A broad stroke look like this of where the market is likely to go is useful if you are a mutual fund investor whose investments generally follow the whole market, or someone who’s willing to invest in inverse funds to benefit from downside moves. My list on whether to buy or sell the current market is shown below:

Reasons S&P500 will Go UP (BUY)

Reasons S&P500 will Go DOWN (SELL)

1.       The market is still down 42% from its highs

1.       The market is up 25% from its lows.

2.       There is a lot of cash on the sidelines

2.       Market volume is moderate, at best.

3.       There are signs of improvement in the economy

3.       The economy decline was worse than anticipated in the first quarter, which could get even worse as initial reports are revised.

4.       The government has undertaken unprecedented monetary stimulus.

4.       Corporate earnings are forecast to decline until the 4th quarter (Standard & Poor’s)

5.       The government has some fiscal stimulus starting to kick in.

5.       Standard & Poor’s estimates that the S&P 500 will have a negative price/earnings (P/E) ratio in the third quarter of 2009

6.       There has been some improvement in consumer confidence surveys and reported spending

6.       Dividends are declining (S&P500 first-quarter 2009 dividends $5.96, down from $7.15 in fourth quarter 2008)


7.       P/E ratios never hit the historic bottom.  Currently S&P500 is about 15. The high historic bottom is 8 and the recent market bottomed at 12. (Based on 10 year averages as calculated by Robert Shiller)


8.       Housing prices continue to decline and could reach the levels of 2002 if the Japan experience is duplicated.


9.       The initial stress test shows that banks are still undercapitalized so lending will continue to be weak.

If you have more reasons the market will go up, please add them in the comments.  There are more reasons to put onto the down side but the list is already too depressing. 

If you’re cautious, then the best thing is to be out of the market.  If you’re aggressive than there seems to be more downside from here than there is upside and inverse funds are an opportunity for you.

If you’re a stock picker there are plenty of value stocks to pick from today though I’m personally waiting for the next leg down to buy.

I enjoy observing the evolution of the economy, but we should name the new animals that have been created.

Modern bankruptcy laws were implemented in 1898 after literally hundreds of years of experience proved that debtor’s prisons were ineffective. After all, if someone has no money putting them in prison simply eliminated the opportunity for them to make money to repay their debts.  Since then, businesses have been trying to eliminate the opportunity for individuals to get out of debt, though they have never come up with a solution to most debtor’s major problem:  lack of money.

The 2005 revision to the bankruptcy law tried to make sure people would try to repay debt.  One section of it eliminated the opportunity for bankruptcy courts to modify mortgages on primary residences by placing the portion above the market value of the house on par with other unsecured debts.”  The logic in 2005 was that the financial companies that owned the mortgages would be better at judging whether to modify them than a bankruptcy judge.   In 2009, we have some reason to doubt the judgment of finance companies.

In any case, I’ve never understood how banks could justify removing bankruptcy protection for primary residences while leaving it for second homes and investment properties.  … When enacted, this clearly encouraged individuals to undertake moral hazard by gambling with the bank’s money on vacation homes and investment properties.  It actually did this in practice (along with a lot of other distorting factors) as 1/3 of homes sold in 2005 were second or vacation homes. These vacation and second homes represent the majority of excess housing in the United States.

Worse, making primary residences a unique class of assets distorts the system and slows down the “creative destruction” that is key to renewal of an economic system. The questions this note addresses are:
1.   “What is the rationale behind continuing this distortion?”
2.   “What should this rationale to be called?”
 
This could simply be a distortion to benefit financial companies which could be called Bankism, the preference of banks and other financial companies over other interests. This is certainly prevalent in today’s government with preference for financial institutions’ interests over those of taxpayers. 
 
However, the recent refusal by the Senate to repeal this distortion may indicate that it is part of a larger trend to favor business (and managers) over the interests of private individuals. The net result of the primary residence exclusion is to favor ownership by business over ownership by individuals. After all, the current rule holds the individual 100% responsible for paying too much for his home and eliminates the ability of the bankruptcy judge to hold the bank at least partly responsible for lending more than the home was worth. 
 
What do you call favoring business ownership over private ownership? If Capitalism is the private ownership of property and Socialism is the state ownership of property, is tilting the rules of ownership of property in favor of business “Business Socialism”, “Business Capitalism” or something new like “Businessism”?

There has been a lot of discussion (or hot air, depending on your opinions) generated on whether deficit stimulus spending helps or hurts the economy in the long run. Keynesians are pretty straight forward in their support of deficit investment as the fastest way out while many conservatives support only Monetary Policy as the better alternative. 

There is support for both ideas but recently I received a statement by Van Hoisington and Dr. Lacy Hunt that seemed to be contrary to the historical record that it quotes: “the historical record indicates that massive increases in government debt will weaken the private economy, thereby hindering rather than speeding an economic recovery.“  If it was true, it would certainly indicate that deficit stimulus spending was bad. However, it could only be true if deficit spending lowers the growth rate because the United States, as a capitalistic country, has private ownership of the means of production. Any GDP growth benefits the private economy.
 
To check this, I did the simple chart below showing the Budget Surplus or Deficit for the USA from 1929 to present versus GDP Growth (Inflation Adjusted)  using Census data.  The upwardly distorted mirror image on the chart over an 80 year period makes it clear that in the USA increases in deficit have usually resulted in leveraged increases in growth. (It has to be this causation because GDP Growth increases tax revenues so Growth could not increase the Deficit.) How this can be interpreted as weakening the private economy is beyond my comprehension and it certainly does not show any “hindering” of recovery.  Perhaps they used foreign data not applicable to the USA?
GDP Growth Vs. Budget Deficit
Note that after 1972 the leverage relation… weakened, probably due to more reliance on tax cuts instead of direct investment when we were already running a deficit.   There was an even bigger disconnect in deficit effectiveness in 2004, possibly indicating that tax cuts when the USA is running deficits actually have a negative effect, probably because people save most (or pay down debt) recognizing that they will just have to pay the tax cut back in the future.   The Dr. Romer’s, in their paper The Macroeconomic Effects of Tax Changes: Estimates Based on a New Measure of Fiscal Shocks, showed that an increase in taxes designed to reduce an inherited deficit had a positive effect on GDP growth (1993, for example) so perhaps the opposite is also true.
Based on this information, it’s pretty clear that Keynesians are correct that deficit stimulus investment can speed economic recovery without long term negatives. The question that remains open is whether tax cuts help or hinder recovery when we are running a deficit. The answer has significant policy implications as further tax cuts may just make the current crisis worse while tax increases could speed the recovery. 

Credit Default Swaps (CDS) are going to wipe out most companies that wrote them due to the cascading effects of a default.  Any company that has CDS expose will never be a good speculative investment.

A Credit Default Swap is basically an unregulated insurance policy that any company can write on any financial instrument that someone else wants to reduce their risk on.  During the financial boom times (up until early 2008) banks, hedge funds and other companies would sell CDS’s and then buy a CDS on the same security to offset their risk and make money on the spread.  This multiple sell/buy is why CDS notional value is $54 Trillion, about 2 times the USA GDP.

A default on a security that a CDS is written on has a geyser like effect:  The default flows like water from the security holder to their CDS writer, who passes it on to their writer who does the same.  Ultimately, it comes to a CDS that is naked (without CDS or other reinsurance) and the writer has to pay up.  As most of these companies were leverage 30 to 1, it is unlikely that they will be able to pay.   Just like water that hits the hot bottom of a geyser, this claim shoots back up the system until it finds a financial entity that can pay up.  Add enough defaults together and you get something with the predictability of “Old Faithful” that will blow up all the writers which includes many of our major banks.

A CDS default forces banks and other writers to put out more money.  In Japan during the 90’s banks were insolvent because the securities behind loans had gone bad and the government simply put off having banks recognize the loss until they could do so without going bankrupt.    With CDS’s, writers will need additional capital – banks will get it from the Government but hedge funds, etc. will go bust.

The system will remain frozen due to fears that the deepening recession will cause CDS defaults to happen.  Establishing a clearing house for derivatives may not help as it may force an immediate recognition of the liability of CDS’s by banks.  Not establishing a derivative market/clearing house is probably worse as the system can’t clear itself without a fair and open market.

Looks like all roads lead to bank nationalization:  Do something and it will force recognition that banks are undercapitalized (York University Professor Nouriel Roubini estimate the gap at $2.2 trillion.)  Don’t do anything and bank will be forced to keep asking for money as CDS’s are claimed – a lot of money that will ultimately result in the Government owning most of them even if it doesn’t want to.